Annual Cost of Living Monte Carlo Models
Cost of Living Projections
Introduction
I do not like negotiating for salary. Especially, without valid projections to determine a range.
I prepared this report to estimate a salary expectation that will maintain my current standard of living.
I present two Monte Carlo models of Houston and NYC annual living costs. The data is somewhat dated and --particularly in the case of houston-- are high level estimates.
In order to produce a better report, I am currently scraping data from the internet for more accurate sample distributions. I will be able to present that soon.
With that said, the model should not deviate by more than about 5-10 percent from what is presented in below.
Findings
An annual salary of $90,000 would be sufficient to qualify for rent in Houston and most likely the median level income neighbors of NYC.
I came about this number by quantifying a confidence inverval of annual rent costs in boths cities across a normal distribution. I then simply multiplied that number by 3 in order to meet the lease qualifications of most landlords.
Limitations of the Model
Old Nyc Data
The data I am using was sourced from 2018. I will be updating it soon.
Houston Data
The houston estimate is based an estimate to stay in the property I am currently staying in. The rent is 2400 a month. I estimated that it could raise at maximum to about 2600 in the next year. If I were to move similiar housing goes for around 2200 to about 2600 a month. I used these as the bounds of my estimates
Houston Cost of Living Expenses
I intend to stay in Houston for the next year. I would like to move to NY eventually to be nearer to a central office, but not in the near future.
=
=
= 2500
= 100 #file:///Users/jnapolitano/Downloads/LNG_Shipping_a_Descriptive_Analysis.pdf
=
=
=
Houston Monthly food costs
=
=
= 400
= 50
=
=
=
Houston Insurance Costs
=
=
= 250
= 25
=
=
The Houston Cost of Living DF
=
=
=
=
= + +
| rent | food | insurance | monthly_cost | |
|---|---|---|---|---|
| 0 | 2472.688851 | 334.419350 | 231.162225 | 3038.270426 |
| 1 | 2399.284893 | 444.677340 | 248.645107 | 3092.607340 |
| 2 | 2684.456976 | 430.277801 | 252.578613 | 3367.313390 |
| 3 | 2478.390464 | 360.661703 | 291.989836 | 3131.042002 |
| 4 | 2513.324309 | 429.771020 | 252.866861 | 3195.962190 |
| 5 | 2501.390892 | 413.121444 | 243.717854 | 3158.230190 |
| 6 | 2554.433859 | 363.994333 | 226.672435 | 3145.100627 |
| 7 | 2530.369935 | 299.997467 | 239.663510 | 3070.030911 |
| 8 | 2635.681318 | 394.667441 | 241.502045 | 3271.850803 |
| 9 | 2596.457738 | 513.944623 | 229.362551 | 3339.764912 |
| 10 | 2455.017883 | 371.266360 | 283.637179 | 3109.921421 |
| 11 | 2427.449703 | 485.960065 | 276.488430 | 3189.898198 |
Houston Costs Per Annum Algorithm
The algorithm below calculates the annual cost of rent, food, and insurance to determine total cost per year. Rent, food, and insurance are set by random choice based on the distributions defined in the functions above.
I run the simulation 10,000 times which in theory corresponds to 10,000 random samples of annual costs. The point in doing this is to create a random normal distribution to define convidence intervals of my total annual costs.
= 10000
= 0
#carbon_total_millions_metric_tons = 300000000
#total_tons_shipped = 0
= 0
=
=
=
=
= 0
# Define a New DataFrame. It should fall out of scope with each iteration
=
#random choice of rent
=
#random choice of food
=
#random Choice of Insurance
=
#Random Choice of total annual cost
= + +
# must use apply to account for multiple 0 conditions. If i simply vectorized the function across the dataframe in a single call i would assign the the same values each day
#calculate cost per day for fun...
# query all that are = o. Summate the capacities deduct the total
=
=
=
=
=
=
=
=
#print(carbon_total_millions_metric_tons)
= +1
Houston Prediction Df
=
=
=
=
=
| rent | food | insurance | total | |
|---|---|---|---|---|
| count | 10000.000000 | 10000.000000 | 10000.000000 | 10000.000000 |
| mean | 30003.016272 | 4800.864106 | 2997.910667 | 37801.791045 |
| std | 344.473477 | 171.736899 | 86.991071 | 394.976839 |
| min | 28586.298471 | 4159.970425 | 2699.038887 | 36163.596078 |
| 25% | 29771.562236 | 4683.226307 | 2940.117598 | 37537.005225 |
| 50% | 30003.442289 | 4800.664909 | 2997.584664 | 37797.598919 |
| 75% | 30234.927776 | 4915.307716 | 3056.853675 | 38072.961560 |
| max | 31370.239418 | 5495.020896 | 3314.016695 | 39469.935965 |
Houston Annual Cost Histogram
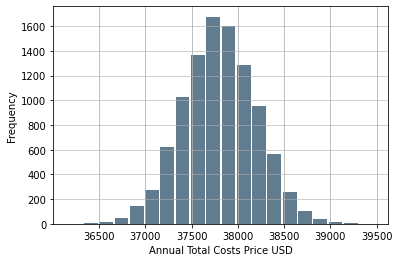
Houston: Calculating the Confidence Interval For Total Costs
The data is nearly normal. Greater samples sizes would produce a graph of nearly perfect normality
(37795.2942543157, 37808.287836034055)
Houston Annual Rent Histogram
### Annual Cost Histogram Histogram
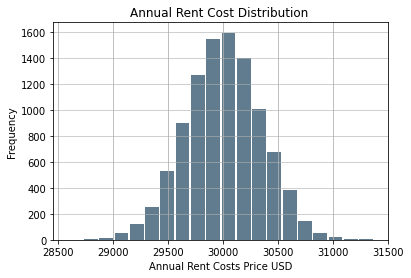
Houston: Calculating the Confidence Interval For Annual Rent
The data is nearly normal. Greater samples sizes would produce a graph of nearly perfect normality
(29996.264715447538, 30009.767827637417)
New York Cost of Living Expenses
For the sake of comparison, the New York Expense distributions are calculated below. I assume that everything but rent will be equivalent to Houston. A more accurate model would account for insurance, food, and incidental differences.
I am assuming the rent of a two bedroom apartment.
The data i am using was scraped from craigslist in 2018. I will redo it later for 2022 data to get a better model.
=
#assuiming a two bedroom
=
| Zipcode | Price | |
|---|---|---|
| count | 2626.000000 | 2625.000000 |
| mean | 10845.203351 | 2755.018286 |
| std | 556.758722 | 7465.827048 |
| min | 10001.000000 | 16.000000 |
| 25% | 10065.000000 | 1950.000000 |
| 50% | 11210.000000 | 2330.000000 |
| 75% | 11231.000000 | 2922.000000 |
| max | 11697.000000 | 378888.000000 |
The price is about 2800 with a std of 7,465. Which is absurd. To do a better analysis, I need to clean the data.
= &
=
| Zipcode | Price | |
|---|---|---|
| count | 2441.000000 | 2441.00000 |
| mean | 10881.331422 | 2435.25891 |
| std | 541.102216 | 728.96291 |
| min | 10001.000000 | 600.00000 |
| 25% | 10302.000000 | 1950.00000 |
| 50% | 11211.000000 | 2300.00000 |
| 75% | 11233.000000 | 2750.00000 |
| max | 11697.000000 | 4495.00000 |
When accounting for outliers the data is far more managable. I'm surprised by the mean price. Again this data is old, but it is also does not accout for neighborhoods. I will redo the analysis at a later data filtered by neighborhoods.
Creating the NYC Distributions
=
=
= 2435
= 729
=
=
=
NYC Monthly food costs
=
=
= 400
= 50
=
=
=
NYC Insurance Costs
=
=
= 250
= 25
=
=
NYC Cost of Living Distribution
=
=
=
=
= + +
| rent | food | insurance | monthly_cost | |
|---|---|---|---|---|
| 0 | 2440.594149 | 404.104193 | 263.802114 | 3108.500457 |
| 1 | 3509.157666 | 399.234822 | 206.641152 | 4115.033640 |
| 2 | 3351.649621 | 297.314475 | 284.177204 | 3933.141300 |
| 3 | 1977.607960 | 359.872656 | 255.831381 | 2593.311996 |
| 4 | 2169.224724 | 386.271512 | 244.469415 | 2799.965652 |
| 5 | 2661.843885 | 356.660878 | 218.425732 | 3236.930495 |
| 6 | 3595.833071 | 385.012912 | 273.882653 | 4254.728637 |
| 7 | 1765.419028 | 404.770447 | 236.665360 | 2406.854835 |
| 8 | 1708.955308 | 348.178355 | 231.690103 | 2288.823766 |
| 9 | 3227.258413 | 392.787025 | 252.315570 | 3872.361007 |
| 10 | 1941.492537 | 404.384587 | 247.628257 | 2593.505381 |
| 11 | 2081.218740 | 416.678465 | 213.204362 | 2711.101567 |
NYC Costs Per Annum Algorithm
The algorithm below calculates the annual cost of rent, food, and insurance to determine total cost per year. Rent, food, and insurance are set by random choice based on the distributions defined in the functions above.
I run the simulation 10,000 times which in theory corresponds to 10,000 random samples of annual costs. The point in doing this is to create a random normal distribution to define convidence intervals of my total annual costs.
= 10000
= 0
#carbon_total_millions_metric_tons = 300000000
#total_tons_shipped = 0
= 0
=
=
=
=
= 0
# Define a New DataFrame. It should fall out of scope with each iteration
=
#random choice of rent
=
#random choice of food
=
#random Choice of Insurance
=
#Random Choice of total annual cost
= + +
# must use apply to account for multiple 0 conditions. If i simply vectorized the function across the dataframe in a single call i would assign the the same values each day
#calculate cost per day for fun...
# query all that are = o. Summate the capacities deduct the total
=
=
=
=
=
=
=
=
#print(carbon_total_millions_metric_tons)
= +1
NYC Prediction Df
=
=
=
=
=
| rent | food | insurance | total | |
|---|---|---|---|---|
| count | 10000.000000 | 10000.000000 | 10000.000000 | 10000.000000 |
| mean | 29219.509691 | 4797.809482 | 3004.224643 | 37021.543816 |
| std | 2532.300418 | 172.673041 | 87.221734 | 2542.267617 |
| min | 18744.517281 | 4116.639699 | 2574.323735 | 26447.949901 |
| 25% | 27545.387716 | 4678.877662 | 2945.270499 | 35351.052672 |
| 50% | 29244.878069 | 4797.251203 | 3005.337764 | 37034.425389 |
| 75% | 30915.545611 | 4915.266687 | 3062.210984 | 38722.269645 |
| max | 38516.336096 | 5429.519670 | 3327.233629 | 46383.324453 |
NYC Annual Cost Histogram
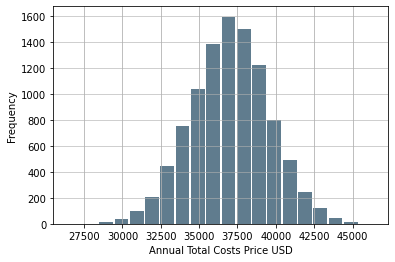
NYC: Calculating the Confidence Interval For Total Costs
The data is nearly normal. Greater samples sizes would produce a graph of nearly perfect normality
(36979.727235126586, 37063.36039733022)
NYC Annual Rent Histogram
### Annual Cost Histogram Histogram
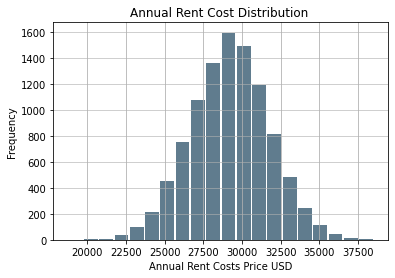
Calculating the Confidence Interval For Annual Rent
The data is nearly normal. Greater samples sizes would produce a graph of nearly perfect normality
(29169.877514702926, 29269.14186706609)
NYC Closing Remarks
The rent distribution in NYC with 2018 data is actually nearly comparible to my houston estimate. An annual salary of 90,000 would permit me to live at about the median level in the city. I will be redoing this report soon as the data is old. I am currently scraping data in houston and nyc to produce a better analysis.
Imports